Is AI a Bubble?
Research — all reports
The complete catalogue: current investigations, earlier reports, evidence dates and source-linked data.
All eight research reports are here: four current investigations and four preserved earlier reports. The whole-system assessment connects the question; each current chapter deepens it. Historical reports remain accessible evidence of what was previously explained, not competing current answers or automatically discredited findings.
Use Spending & obligations, Investment returns and Evidence & tests for subject-led explanations. This catalogue takes you directly to the complete reports and their data.
Report-to-question map · eight reports
Each investigation tests a different part of the cash chain
Scroll sideways on a narrow screen. All eight linked reports are listed below.
Current research
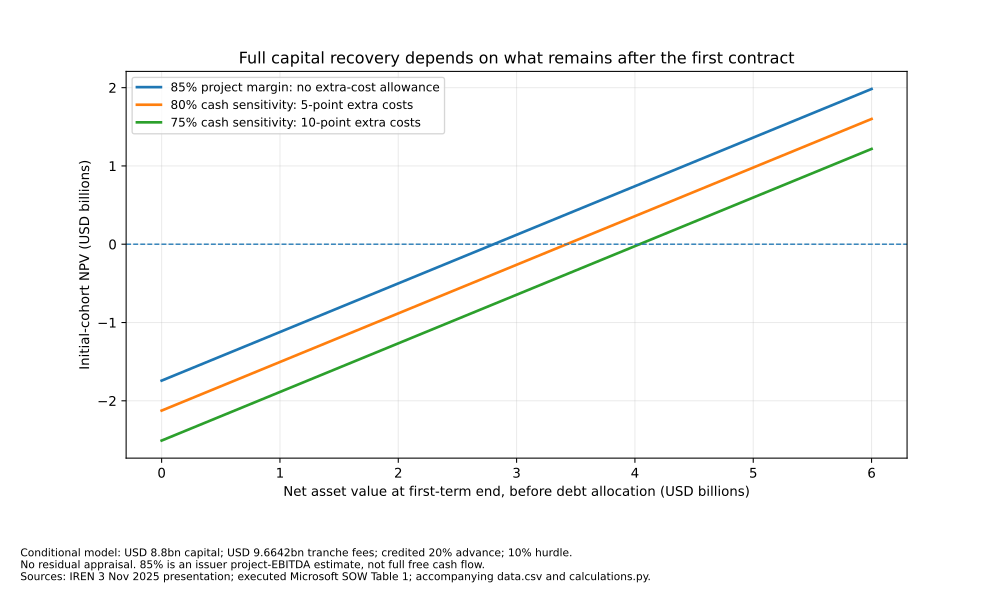
Current physical-capacity and recovery investigation
Capacity that earns revenue is not yet capital that earns its cost
Accepted capacity, IREN’s equipment and facility budgets, customer advances and extended service terms, finite replacement cycles and conditional continuation-value thresholds. Preserves the CoreWeave repayment case and distinguishes facility-only hosting economics.
Read the full report → · Inspect the 83 inputs and assumptions · Recovery sensitivity figure
Current financing investigation
Who has to pay when AI returns disappoint?
Meta-backed contracted repayment, CoreWeave cash and reserve thresholds, conditional collateral recovery, NVIDIA residual-value support and parent resilience. Explains creditor containment, equity loss and the missing links to wider transmission.
Read the full report → · Inspect source-linked data and assumptions
Current whole-system assessment
Real demand, demanding prices, and growing repayment risk
Customer value, spending, financing, recovery, valuation and loss transmission in one connected assessment. Conditional models retain their assumptions and the NVIDIA receipt correction.
Current demand investigation
Real customers, uneven capture
Support, coding and office assistance show how useful work becomes payment—and why providers may not retain enough. Includes buyer hurdles, recurring-purchase evidence and price/volume/cost sensitivities.
Earlier research — the complete preserved record
Historical · Debt, collateral and repayment
The loan runs for years. Repayments can start earlier.
March principal schedule, borrower collateral and parent-guarantee boundaries, with selected May and June terms. The current assessment uses a June snapshot; the original remains dated.
Historical · Financing, payment and risk
The round closed. Did the money arrive?
Investor payment disclosures, conditional facilities and guarantee gates. Its prepaid-forward treatment establishes an obligation without claiming verified receipt.
Historical · Cash, commitments and capacity
The spending is real. The payback is still a question.
Matched half-year cash, separate leases and commitments, and physical-delivery boundaries. This report already corrected the missed Amazon payment disclosure.
Historical · Earlier profits and utility baseline
Real profits do not settle the bubble question
Company results and scoped productivity studies. Its incomplete Amazon funding-evidence coverage was subsequently corrected in Cash, commitments and capacity.
What changed, with the reason attached
Full-cost recovery: the earlier general cohort model is now complemented by a disclosed IREN customer contract and separate equipment/facility budgets. The narrower equipment perimeter can clear a hurdle while the combined investment requires continuing value. This is a better-defined calculation, not a newly observed company loss. The cost and cash boundary.
Contractual timing and capacity: the delay analysis retains extended service terms instead of automatically deleting fees; the replacement-cycle test charges new capital and shows a fixed-capacity limit to volume growth. Future prices, utilization and net asset value remain assumptions. Timing protection; continuation thresholds.
Stronger contractual containment: April DBRS analysis identifies Meta’s take-or-pay contract and expected full amortization. This is newly incorporated underwriting evidence about a dated arrangement—not a new September customer contract or verified compliance. Repayment proposition and limits.
Real-obligation cash and recovery tests: the investigation now reconciles actual principal and interest payments and derives collection, reserve and collateral thresholds. Unknown project schedules remain variables; assumed sale values are not observed prices. Definitions and numerical boundaries.
Financing stage advanced, receipt still prospective: the September 17 proposal became $3.7bn of priced notes on September 18, with expected September 22 settlement. The 20 September cutoff does not count proceeds as received. Dated cash calendar.
Deeper demand evidence: positive coding field evidence, office time savings and recurring payment strengthen commercial substance. Distinct populations and outcome measures remain separate. The findings do not establish complete cash margins or annual paid renewal. Demand investigation.
Measurement window: the $510.703bn July–June parent cash-investment total contains January–June’s $294.800bn. These are overlapping periods, not amounts to add. Nested-window visual and exact basis.
Later financial period: the June debt snapshot replaces March in the current assessment. A smaller through-2027 share is not pure deleveraging. What the two snapshots do and do not say.
Attributed profitability evidence: the favorable Anthropic adjusted-profit reporting remains visible, with its stock-compensation exclusion and limited access to underlying documents. Interpretation and source.
Explicit conditional models: capital recovery and ownership prices now have inspectable assumptions. These do not turn incomplete market or private-account information into fair-value estimates. Investment returns.
Previously corrected evidence coverage: Cash, commitments and capacity had already corrected the first baseline’s missed Amazon filing. The disclosure was available before the omission; the current assessment does not claim its discovery.
NVIDIA receipt characterization: the stronger assertion about what the prepaid-forward contract proves is withdrawn. Obligation is established; receipt remains unverified, not disproved.
NVIDIA entered into a $1.5bn prepaid-forward contract with Energy Global, LP. The agreement requires payment within three business days after its date. The documents inspected for this investigation do not verify receipt.
Source, exact documentary issue and numerical consequence →
Forecast vintage: the current whole-system account uses the IEA’s April 2026 update; the earlier report retains its older outlook. Both concern global data centers, not measured AI-only cash demand. Dated forecast context.